

TickerDB connects to Claude and ChatGPT and gives your AI assistant real market data to work with. Here are four ways to use it. We'll use MSFT in a few examples, but you can do this with any stock, ETF, or crypto.
1. Screen the market
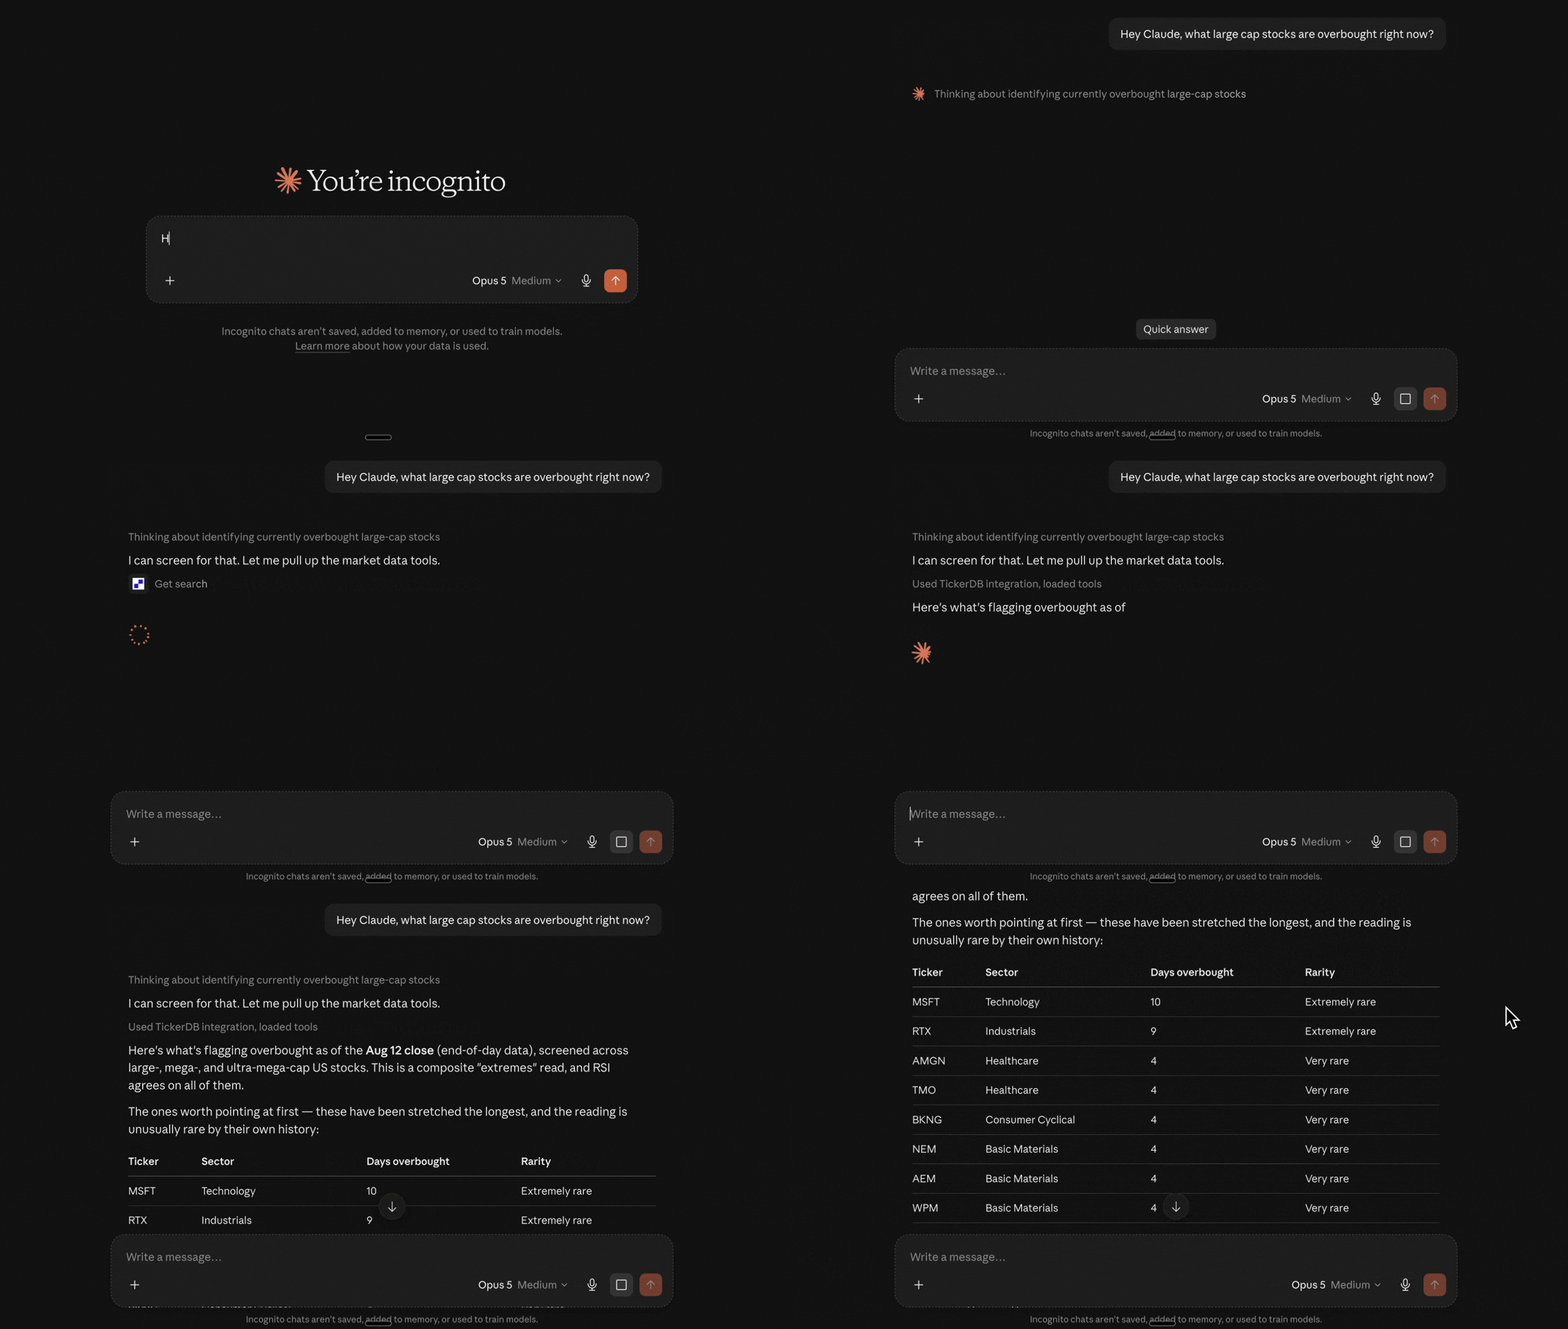
Screen by momentum, trend, patterns, volume, fundamentals, sector context, insider activity, or combine them to get more specific.
For example:
"Show me stage-2 stocks in a bull flag setup."
"Which mega-caps have insider buying?"
"Find oversold stocks with high free cash flow."
2. Analyze a single ticker
Get a quick read on a ticker across trend, momentum, volume, patterns, fundamentals, and sector context, then follow up on whatever stands out.
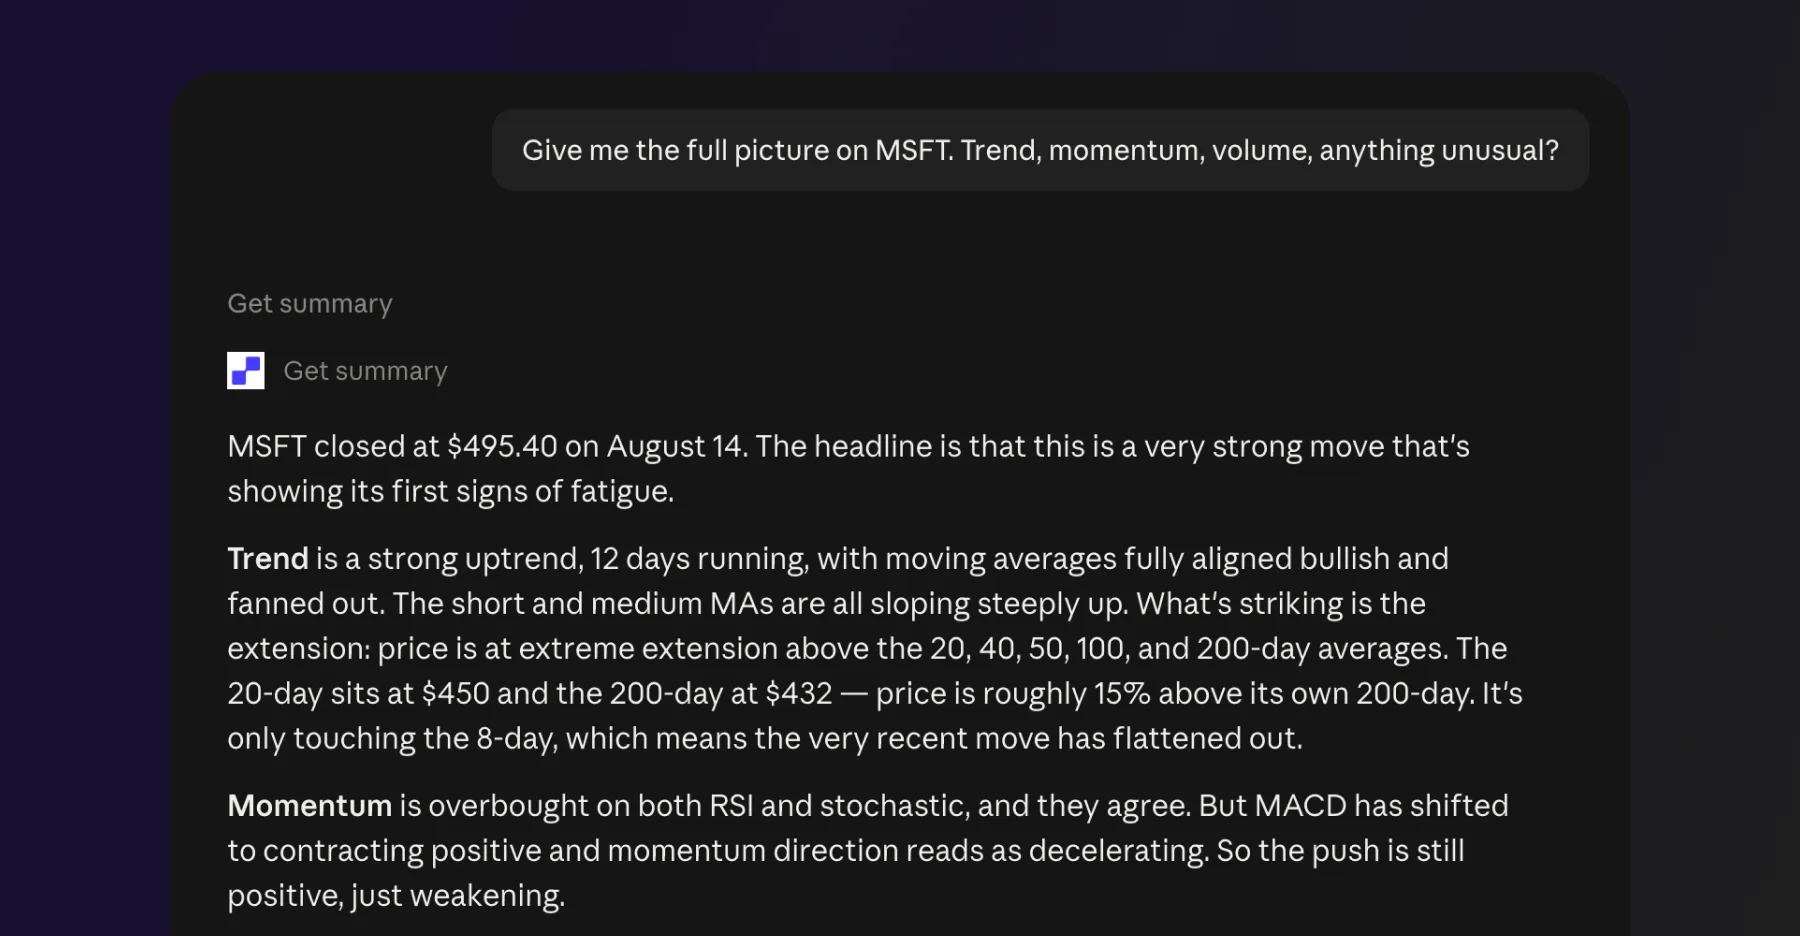
Claude found that MSFT had a strong uptrend, overbought momentum, and a mature bull flag, but insiders were selling heavily into the rally (as of mid-August 2026).
From there, you can dig into a specific signal, compare it with other stocks, or ask for more context around what you're seeing.
3. See how a setup has played out before
Look at forward returns after a ticker has been in a specific condition: 5, 10, 20, 50, and 100 days out.
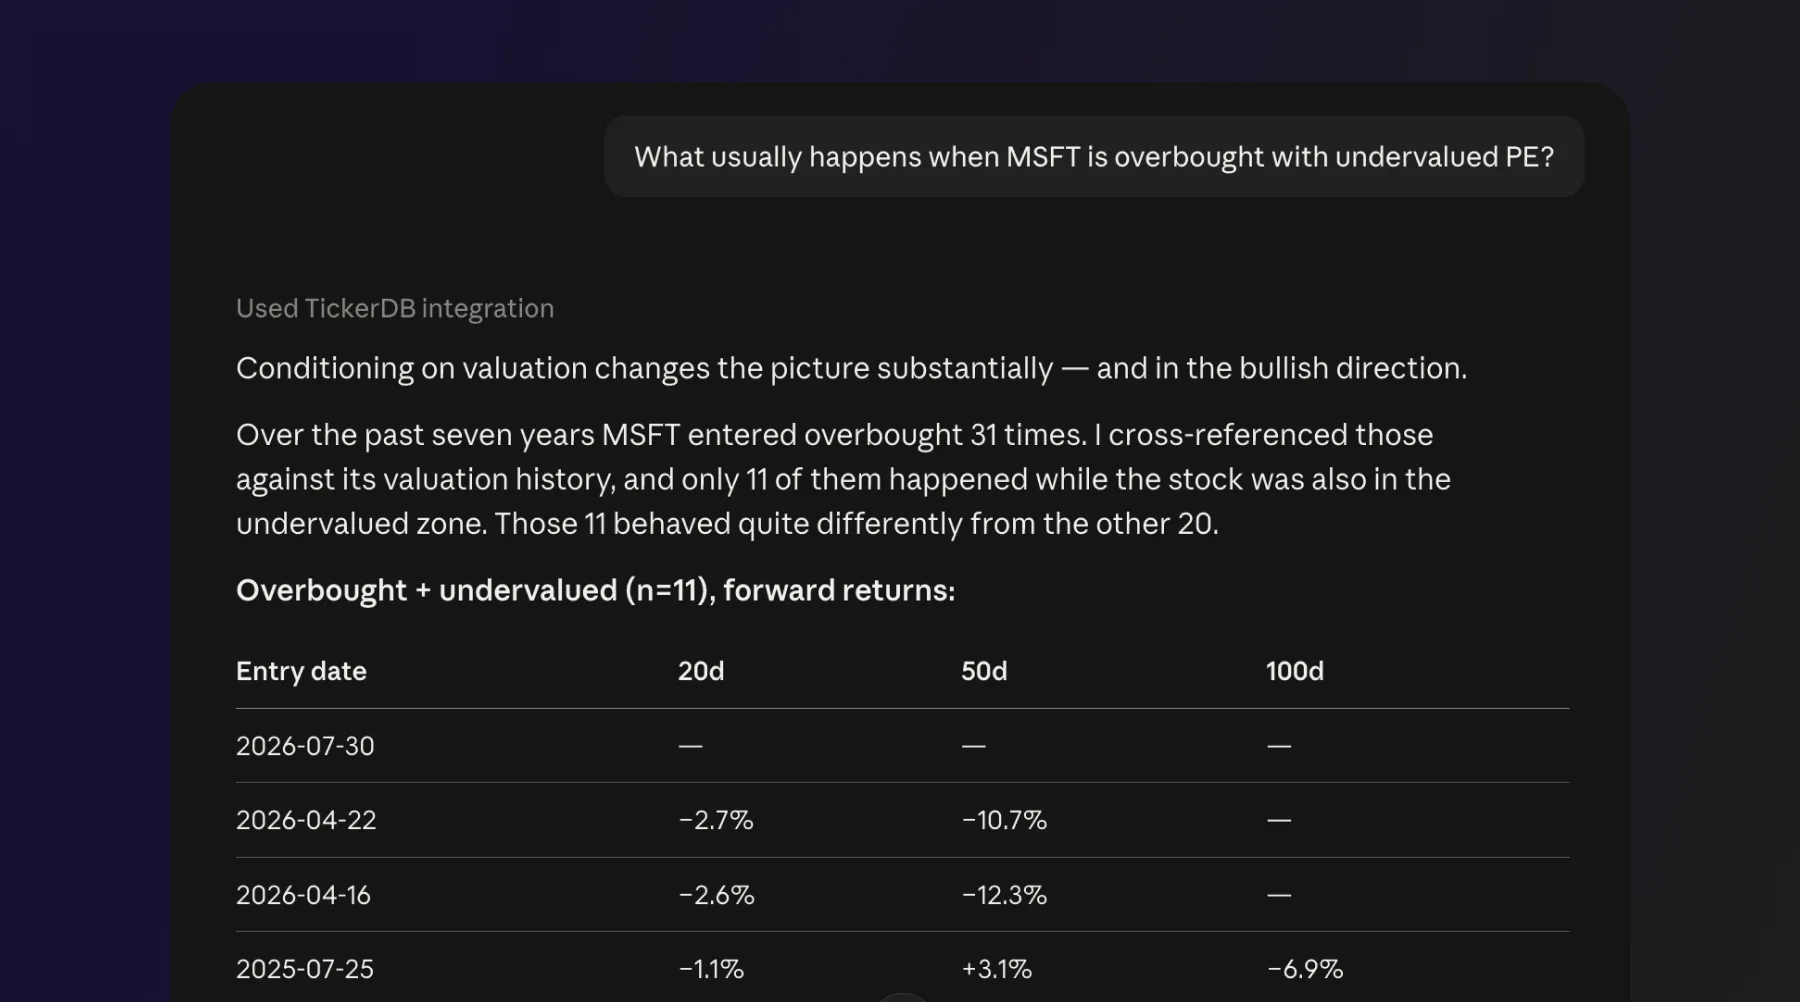
MSFT has been overbought 31 times over the past seven years. Across those periods, the most common 20-day outcome was a slight decline. But when MSFT was also undervalued on PE, the result looked different: across 11 matching periods, 70% were positive 20 days later.
You can run the same historical check on other setups:
"How does BTC usually perform after a volatility squeeze?"
"What happens when AAPL goes oversold during a sector uptrend?"
"Show me what's happened after bull flag breakouts on NVDA."
4. Track tickers for changes
Save the tickers you follow to a watchlist.
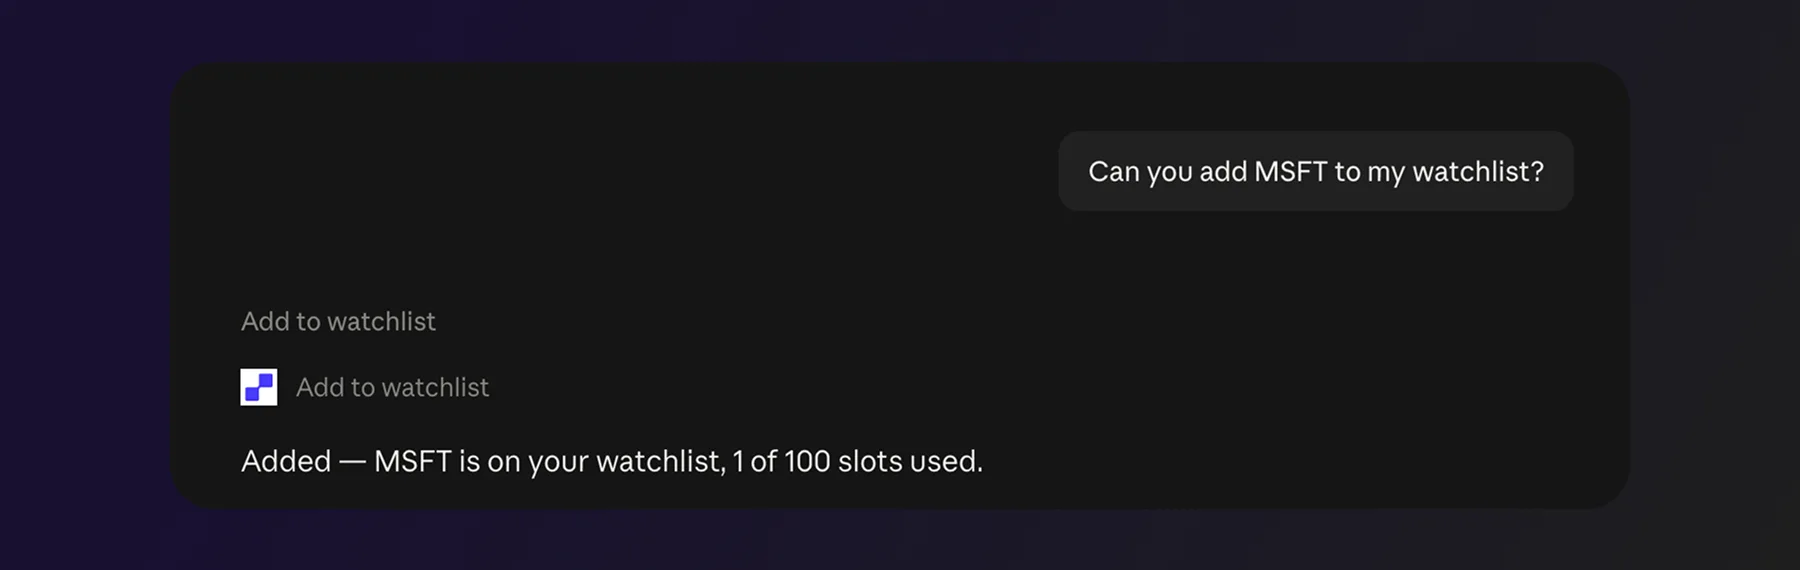
Next time you check, you can see what moved: a trend reversed, volume spiked, or one of your tickers moved into oversold. Or ask your assistant to check your watchlist every morning and send you an update.
Not connected yet? Watch how to set it up: Connect to Claude (video) · Connect to ChatGPT